
[Note : I am getting more concerned that the source data just does not accurately represent the air experience.� This was commented on widely on 18 June 2009 when the air looked real bad but was reported as 158 “slightly polluted”.� Other independent measurements put this day in the “hazardous” category.� I wonder if there is any point continuing.
One of my (acceptable) personal hobbies is monitoring Beijing’s air pollution statistics. My graph based on Beijing’s published statistics is shown below. You can make your own mind up about whether the numbers are improving.� While I had my doubts about improvements, it seems to me that the Beijing Olympics were possibly the biggest factor in improvements since mid-2007.� Of course, the shutting down of a few heavy industries and moving them to other parts of the country may be only exporting the problem elsewhere.� Now its just a battle to keep improving emissions against the seemingly unstoppable number of cars appearing on Chinese roads.
The index is a unique index used by the Chinese authorities and apart from making it difficult to compare with indices used in other countries, the maximum recorded index value is 500, meaning anything more than 500 is recorded as 500.� Note that there was in early 2008 some discussion over the possible “adjustment” of numbers in order to meet targets. It has been suggested that replacing monitoring stations near the centre of Beijing with ones out past the 4th ring road has distorted the results in a downward direction. There is also pretty convincing statistical evidence that some figures just below 100 were astutely adjusted downwards to get below this key target level. Read the following link and decide for yourself :
http://iopscience.iop.org/1748-9326/3/3/034009/fulltext?ejredirect=migration
Beijing Average Monthly Air Pollution Index
| Month | 2000 | 2001 | 2002 | 2003 | 2004 | 2005 | 2006 | 2007 | 2008 | 2009 | 2010 | 2011 | 2012 |
| Jan | 113 | 116 | 93 | 89 | 90 | 128 | 102 | 83 | 83 | 74 | 51 | 86 | |
| Feb | 119 | 110 | 101 | 108 | 76 | 98 | 110 | 73 | 89 | 77 | 101 | 73 | |
| Mar | 158 | 155 | 105 | 125 | 91 | 132 | 96 | 109 | 92 | 108 | 83 | 82 | |
| Apr | 131 | 168 | 104 | 116 | 137 | 177 | 94 | 103 | 83 | 83 | 108 | 115 | |
| May | 154 | 94 | 94 | 87 | 93 | 120 | 106 | 142 | 83 | 89 | 80 | 96 | |
| Jun | 118 | 106 | 89 | 95 | 97 | 92 | 86 | 117 | 91 | 78 | 85 | 86 | 73 |
| Jul | 86 | 84 | 86 | 94 | 77 | 86 | 71 | 94 | 77 | 74 | 87 | 73 | 61 |
| Aug | 89 | 80 | 96 | 86 | 86 | 88 | 74 | 82 | 56 | 76 | 70 | 77 | 70 |
| Sep | 95 | 92 | 91 | 86 | 94 | 98 | 95 | 89 | 57 | 85 | 70 | 73 | 61 |
| Oct | 86 | 118 | 98 | 98 | 139 | 102 | 107 | 80 | 75 | 82 | 82 | 91 | |
| Nov | 128 | 102 | 105 | 119 | 89 | 149 | 115 | 103 | 80 | 97 | 103 | 91 | |
| Dec | 110 | 102 | 135 | 94 | 126 | 82 | 120 | 138 | 98 | 103 | 95 | 73 |
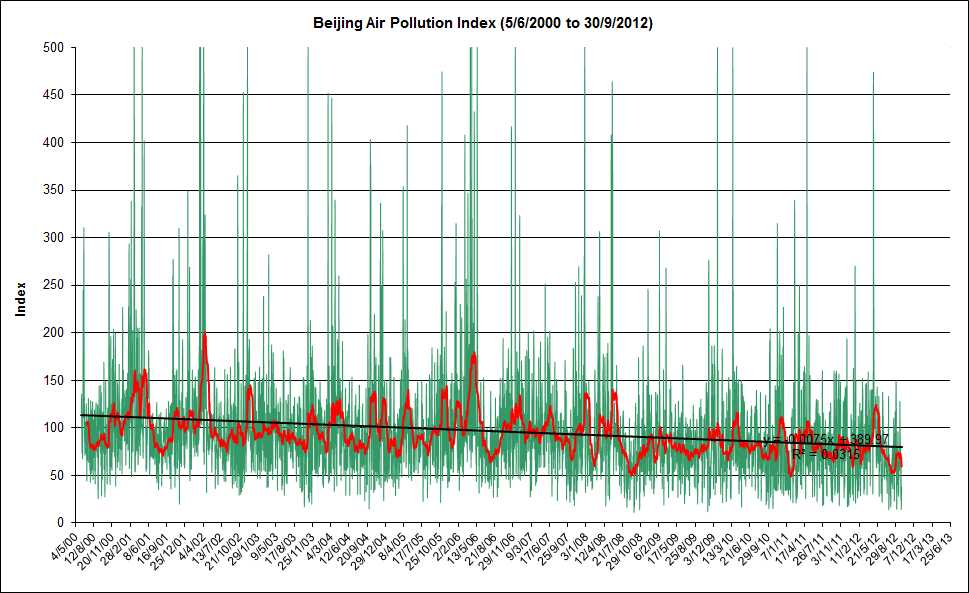
The green line plots the daily values while the red line is a smoothed trendline. The Firefox extension called “Image Zoom” is not bad for manipulating the zoom or you can just click on the image to see it in its own window.